Converting Excel to Interactive HTML: A Deep Dive for Advanced Users
Quick Summary
Excel remains a powerhouse tool in data management, but there are limitations when it comes to sharing, visualizing, and interacting with the data. While Excel files can be shared, they’re often cumbersome to navigate, especially when you have large datasets or need to present complex analysis. One solution is to convert Excel files to interactive HTML pages, offering a more dynamic way to display data directly in the browser.
For advanced users and developers, this process can be highly customized. From adding custom interactivity to optimizing performance, converting Excel data into an interactive web format opens up new possibilities for data presentation. In this post, we’ll explore not just how to convert Excel to HTML, but also how to enrich the experience with advanced functionality, performance optimization, and seamless integration.
Why Convert Excel to Interactive HTML?
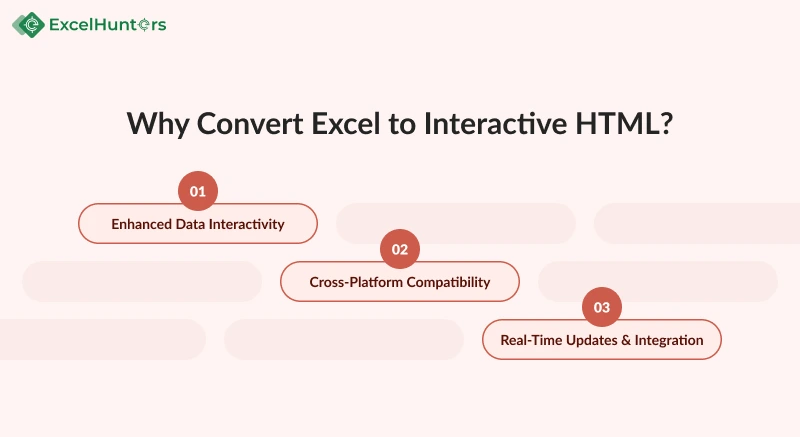
As advanced users, you likely already understand the power of Excel, but converting it into an interactive HTML format offers multiple benefits:
- Enhanced Data Interactivity: Unlike static Excel files, HTML tables can be enhanced with JavaScript libraries that allow for sorting, filtering, pagination, and real-time data manipulation.
- Cross-Platform Compatibility: HTML files can be easily shared, viewed on all devices, and embedded in websites, offering accessibility across platforms without requiring proprietary software.
- Real-Time Updates & Integration: HTML allows easy integration with server-side data, ensuring that data is live and updates automatically without manual reloading.
While these points are useful, as an advanced user, you’ll appreciate the flexibility that comes with the ability to control every aspect of the conversion and interactivity.
Tools and Libraries for Converting Excel to Interactive HTML
1. JavaScript Libraries for Data Interactivity
There’s a wide range of libraries that can turn your basic HTML tables into sophisticated, interactive data grids. Here are the most popular ones, each with distinct features:
DataTables: One of the most popular and powerful jQuery plugins for transforming HTML tables into fully interactive grids. DataTables offers features like searching, sorting, pagination, and even exporting to CSV or Excel.
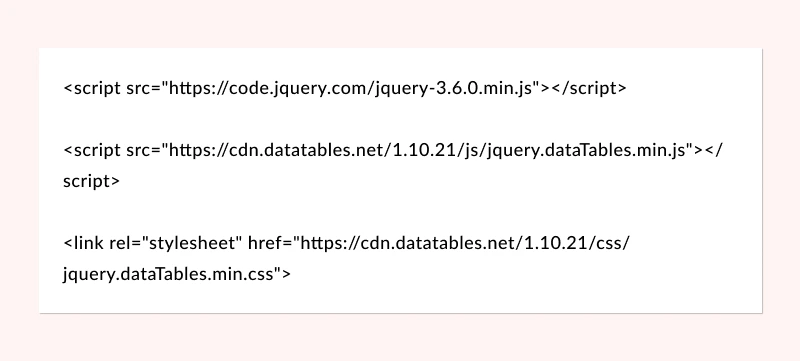
Key Features:
- Ajax Integration: Easily load data from external sources without reloading the page.
- Responsive Design: Automatically adjusts table layout for different screen sizes.
- Server-Side Processing: Handles large datasets by querying the server for only the data that is currently needed.
Handsontable: A powerful JavaScript library for creating spreadsheets in the browser. It’s especially useful for replicating complex Excel features and offering full CRUD (Create, Read, Update, Delete) functionality for users.
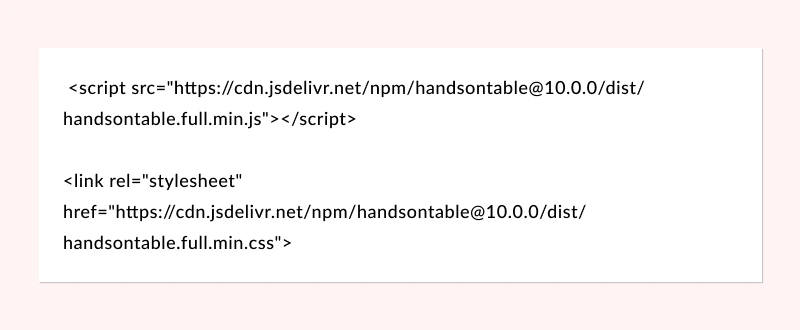
Key Features:
- Excel-like Experience: Supports cell editing, formulae, and multi-sheet functionality.
- Custom Cell Types: You can define custom validation, drop-down lists, and input types.
AG-Grid: This is another advanced grid library that supports enterprise-grade features, including grouping, pivoting, complex data visualizations, and much more.

Key Features:
- Extensive Customization: You can build custom filters, editors, and even advanced data visualizations.
- Excel Export: Allows users to export data grids to Excel directly.
2. Converting Excel Data to JSON for Interactivity
One of the most common methods to bring interactivity into your Excel-to-HTML workflow is converting your data into JSON (JavaScript Object Notation). JSON is a lightweight data format that is easy for JavaScript libraries to consume.
Steps:
1. Export Excel to JSON:
- Open your Excel file.
- Use a library or a plugin like ExcelToJson or SheetJS to convert the data into a JSON format. SheetJS is particularly powerful and supports numerous formats, including Excel, CSV, and JSON.
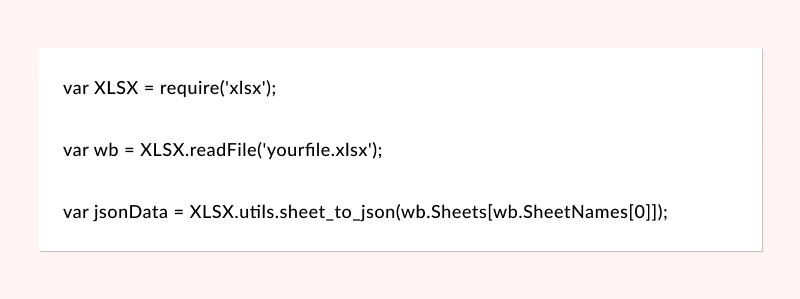
This JSON data can now be passed to any JavaScript library for rendering.
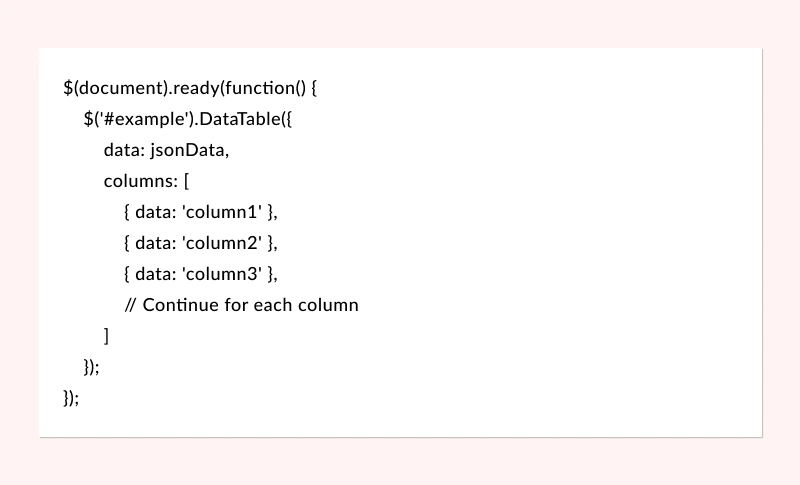
2. Load Data into Interactive HTML Table:
Once the data is in JSON format, libraries like DataTables or Handsontable can easily integrate this data and offer dynamic features like sorting, filtering, and even complex data operations.
3. Advanced Performance Optimization for Large Datasets
When dealing with large datasets, performance can become a concern. Here’s how you can optimize the performance of your interactive tables:
1. Lazy Loading / Pagination:
- Instead of loading all data at once, implement pagination or lazy loading. With DataTables, you can activate server-side processing to only load a subset of the data at a time, which drastically improves performance for large datasets.

2. Virtual Scrolling:
- Virtual scrolling is another performance-boosting technique. Only a small subset of rows are rendered at a time, and as the user scrolls, new rows are dynamically loaded. Libraries like AG-Grid support this out of the box.
3. Efficient Data Structures:
- When handling large datasets, ensure that the JSON or data objects you’re working with are optimized for memory usage. You can consider techniques like indexing or caching parts of the data to prevent repeated computations or lookups.
Integrating Server-Side Data with HTML
For real-time or constantly updating datasets, server-side integration is key. Whether you’re pulling data from a database, an API, or even streaming real-time updates, server-side data integration ensures that your HTML table is always displaying the most up-to-date information.
1. REST API Integration:
- By connecting your HTML table with a REST API, you can dynamically load data from a server and ensure the table is updated in real-time. This is ideal for live dashboards, inventory systems, or any application that requires continuous data updates.
2. WebSocket for Real-Time Data:
- For live data updates, WebSocket connections allow your table to update without needing the user to refresh the page. This is perfect for applications like financial dashboards or collaborative platforms where data changes frequently.
Conclusion: Empowering Your Data with Interactivity
Converting Excel to interactive HTML is more than just a simple export—it’s about transforming your data into a dynamic, real-time, and user-friendly experience. By leveraging advanced JavaScript libraries like DataTables, Handsontable, and AG-Grid, along with performance optimizations and real-time data integration, you can offer a powerful data-driven experience that goes beyond what Excel can do on its own.
For advanced users, the ability to integrate backend data, manage large datasets efficiently, and create a fully customized interactive web interface is invaluable. Whether you’re working with a small report or a vast dataset, these techniques will help you present your Excel data in the most interactive, engaging, and professional way possible.
Ready to turn your static Excel spreadsheets into interactive web-based dashboards? Dive deeper into our resources and start transforming your data today!
Looking for
Consultations?Our Expertise
- 8 + years of experience
- Adept Developers
- Excel at Agile Development
- Cost-Effective


